Cut through the mess of real world data and provide a reliable and objective basis for actionable decisions.
Statistical methods are used to analyse a variety of user research activities including controlled experiments, usability testing, card sorting, data-driven personas, survey research, web analytics and A/B testing.
Click the links below or scroll down for more details.
- Analysis of Experiments
- Analysis of Card Sorts
- Data-driven Personas
- Analyzing Relationships in Survey Research
- Analyzing A/B Testing
How Can I Help?
- Advise on appropriate method/s given your research data and questions
- Carry out statistical analysis of the data and produce appropriate visualisations
- Produce a report summarising actionable findings and relevant statistical files
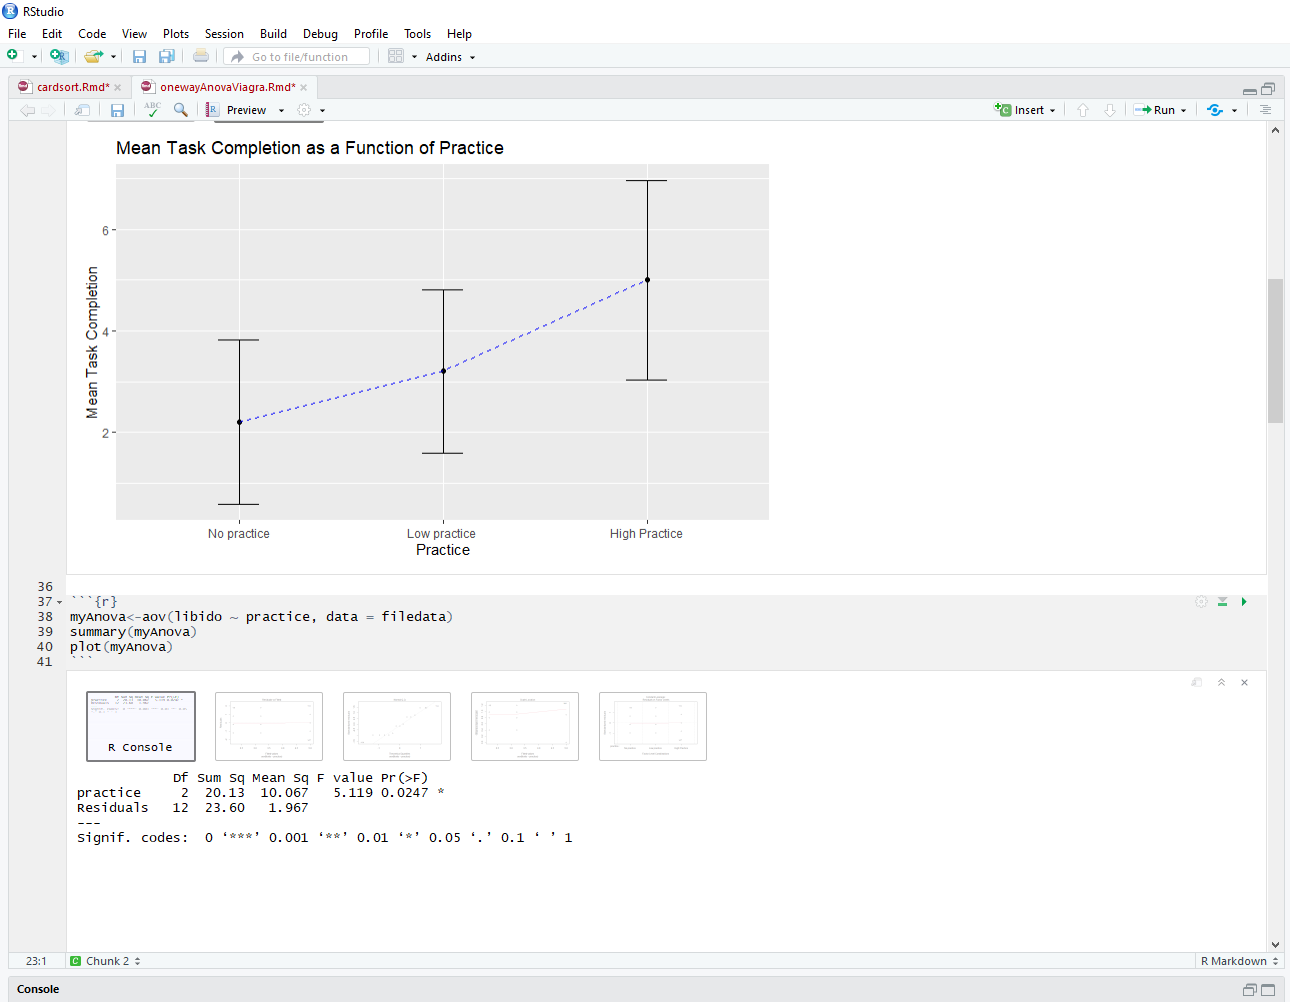
Analysis of Experiments
What's the goal? To compare user behaviour on two or more testing conditions. Metrics include task time, success rates, error rates, self-report measures, scores on usability evaluation questionnaires, and complex behaviours from think-aloud protocols, eye-tracking, mouse/keyboard interactions and gesture data. The testing variable (independent variable) normally involves alternative designs of a user interface. When different independent variables are being compared (i.e. factorial designs) their interactions can be assessed.
What statistics are used? When comparing two conditions t-tests or similar procedures are used. If comparing more than two conditions or independent variables then Analysis of variance (ANOVA) should be used. There are different kinds of ANOVA and t-test procedures for different kinds of experimental designs that differ in terms of how participants are assigned to experimental conditions and whether there are one or two independent variables.
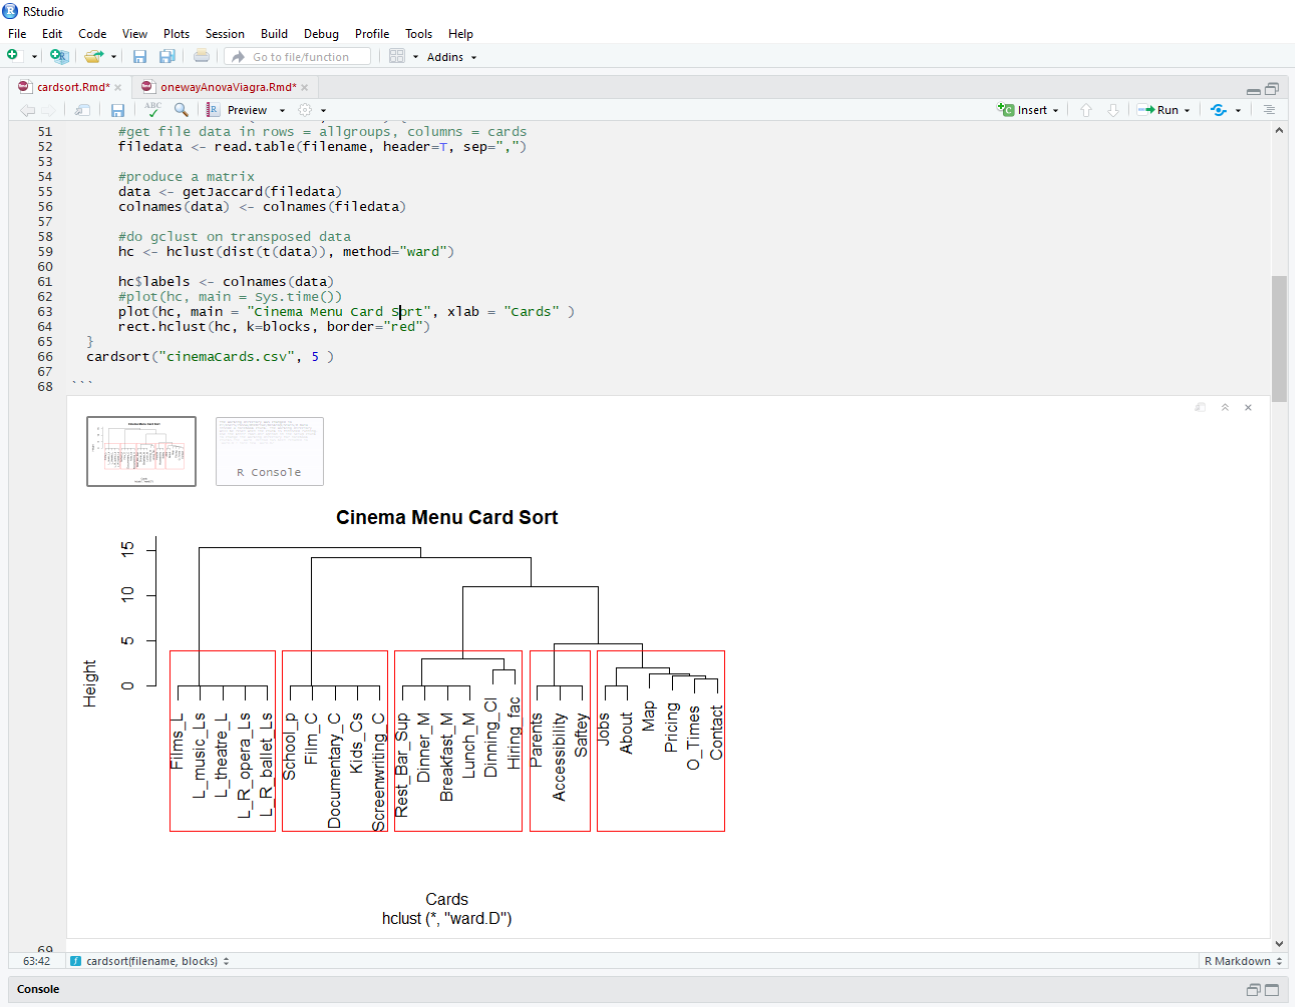
Analysis of Card Sorts
What's the goal? To find patterns of card groups sorted by participants. Questions to be addressed include which cards do participants tend to group? Which cards are assigned to different groups or are not assigned to regular groups?
What statistics are used? Hierarchical cluster analysis, multidimensional scaling, and factor analysis can be used. The most common method for card sorting is hierarchical cluster analysis and dendrogram visualization. Online platforms for doing card sorting normally provide automated cluster analysis and visualizations.
You can use a combination of analysis methods to view the data from alternative perspectives. Hierarchical cluster analysis is good at showing the structure of hierarchical data. Multidimensional scaling has the advantage of making the membership of outlier cards easier to interpret. Factor analysis may be useful for finding high-level categories when the number of card sort categories is large and when cards belong to more than one high-level category.
Analyzing Relationships in Survey Data
What's the goal? To determine the relationship between an outcome variable and one or more predictor variables. Regression analysis can be used to answer questions about the presence and magnitude of predictive relationships between variables in survey data. When a regression model is created it can also be used to predict an outcome value with new data.
What statistics are used? There are different kinds of regression procedures including simple regression, multiple regression and logistic regression. Which procedure should be used depends on if the data involves single or multiple predictors and if the outcome variable is continuous or categorical.
Data-Driven Persona Analysis
What's the goal? To use quantitative statistics to reliably find personas in survey data. A persona survey measures user attributes such as goals, needs, attitudes and interests. Statistical procedures are used to identify user attributes that tend to be uniquely associated with different user groups.
What statistics are used? These include factor analysis, latent class analysis and multiple correspondence analysis. For example, multiple correspondence analysis is used to visualize the similarity between user attributes by plotting them on a graph where relative distances represent similarity. This visualization can then be used to map spatially grouped items to individual personas.
Analyzing A/B Tests
What's the goal? To compare online webpage conditions with real web traffic on some metric (e.g. clickthrough rate). When more than two conditions are compared this is called multivariate testing. A/B testing may require estimating statistical power to determine the required sample size or if a test is worth doing.
What statistics are used? A/B testing typically involves testing conversion rates such as clickthrough rate so two proportion tests are used (e.g. two proportion Z-test). A/B testing platforms usually provide testing tools. There are also numerous free online tools for A/B testing, statistical power calculations and more.